Bike Share Toronto Analysis
Overview
This analysis explores how Bike Share Toronto usage changed between March 2023 and March 2024, focusing on hourly ridership, weekday vs weekend, and member vs casual mix.
The project shows a clear workflow from Excel cleaning to Tableau dashboards, with decisions logged for transparency. The new Financial Extension adds a simple revenue–cost–profit view based on public pricing and documented assumptions.
Project Purpose
Motivation
Living in Mississauga, I rarely saw Lime scooters or shared bikes in active use. Many looked idle or abandoned mid-trip.
That raised a question: are these systems being used effectively, or just growing in size?
I tried to access Lime GBFS but the process stalled, so I pivoted to Bike Share Toronto open data, which is clean and well structured. The work evolved into a business-style analysis that checks if ridership growth kept pace with network expansion.
Core Question
How did Bike Share Toronto usage differ between March 2023 and March 2024 by hour, by weekday vs weekend, and by user type?
Why These Months?
Each monthly file has hundreds of thousands of trips, so a single month can be representative.
I chose March 2023 and March 2024 to keep scope focused while allowing a true year-over-year comparison.
Tools & Stack
Excel (cleaning and validation) · Tableau (visualization) · Python/SQL (planned automation)
Data Summary
- Source: Bike Share Toronto Open Data
- Months analyzed: March 2023 and March 2024
- Volume: ~537k trips combined
- Key fields: Trip ID, duration, start/end stations, times, bike ID, user type
- 2024 addition:
Model(bike type)
- Supplement: Station reference CSV with IDs, names, and coordinates for mapping
March vs March gives comparable seasonal conditions at high volume.
Cleaning & Validation (Excel)
I used a Data Issues Log rather than ad-hoc fixes.
Cleaning Steps
- Coerced types (timestamps to datetime, duration to minutes)
- Dropped incomplete rows with missing start/end station or time
- Removed duplicates with
(start_time, end_time, bike_id)
- Created
Start Hour,Day of Week,Same Station?,Mappable
- Joined station IDs to a reference file and flagged missing IDs as Unmapped
Schema Notes (2023 vs 2024)
| Field | 2023 | 2024 | Notes |
|---|---|---|---|
| Trip Id | ✓ | ✓ | Unique per trip |
| Trip Duration (sec) | ✓ | ✓ | Converted to minutes |
| Start/End Station Id & Name | ✓ | ✓ | Some IDs updated |
| Start/End Time | ✓ | ✓ | Datetime |
| Bike Id | ✓ | ✓ | |
| User Type | ✓ | ✓ | Annual or Casual |
| Model (bike type) | — | ✓ | New in 2024 |
| Derived columns | ✓ | ✓ | Created during cleaning |
Some 2024 station IDs were not in the 2023 map file. They are kept for totals and flagged Unmapped for maps.
Derived Columns
| Column | Type | How it’s computed | Why it matters |
|---|---|---|---|
| Trip Duration (min) | Numeric | duration_sec / 60 |
Consistent time comparison |
| Start Date | Date | date(Start Time) |
Day-level grouping |
| Start Hour | Integer | hour(Start Time) |
Hourly patterns |
| Day of Week | Text | weekday(Start Time) |
Weekday vs weekend |
| Same Station? | Boolean | Start Station Id == End Station Id |
Loops vs A→B |
| Mappable | Boolean | In station reference | Map readiness |
Data Issues (logged)
| Issue | Fix / Decision | Kept? | Example Count |
|---|---|---|---|
| End Station = NULL | Drop row | ✗ | 80 |
| Trip duration < 1 min | Drop row | ✗ | 417 |
| Trip duration > 24 hr | Drop row | ✗ | 43 |
| Start = End station | Keep, flag as Same Station | ✓ | 6,835 |
| Inconsistent station names | Standardize by ID | ✓ | 15,942 |
| Station ID missing (new) | Keep, mark Unmapped | ✓ | 22,000 |
From Excel to Tableau
The two months were unioned and joined to the station reference. Trips with missing reference stayed in totals but were marked Unmapped for mapping.
Key fields used: duration (min), hour, weekday, user type, station names, and Model for 2024.
Dashboards & Insights
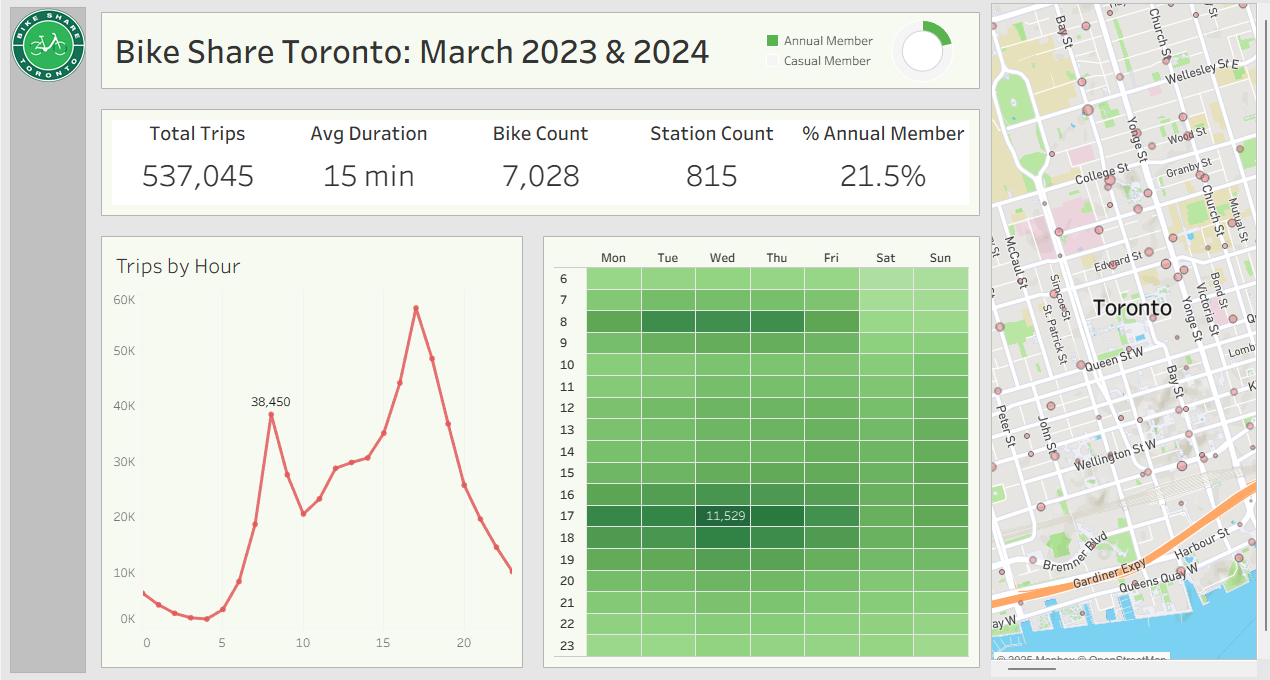
1) Overview Dashboard
At a Glance
- Total Trips: 537,045 (both months)
- Avg Duration: ~15 minutes
- Network Size: 7,028 bikes across 815 stations (about 8.6 bikes per station)
- Annual Members: ~21.5% share
Usage Patterns
- Peaks at 8–9 AM and 5–7 PM fit office commutes
- Midday and weekend rides are steady
- Tuesday to Thursday is slightly higher, matching hybrid schedules
Business Interpretation
- Peaks support dock rebalancing and staffing
- Short average duration fits a first/last-mile role
- A ~1-in-5 membership share suggests room to convert frequent casuals
2) Comparison Dashboard
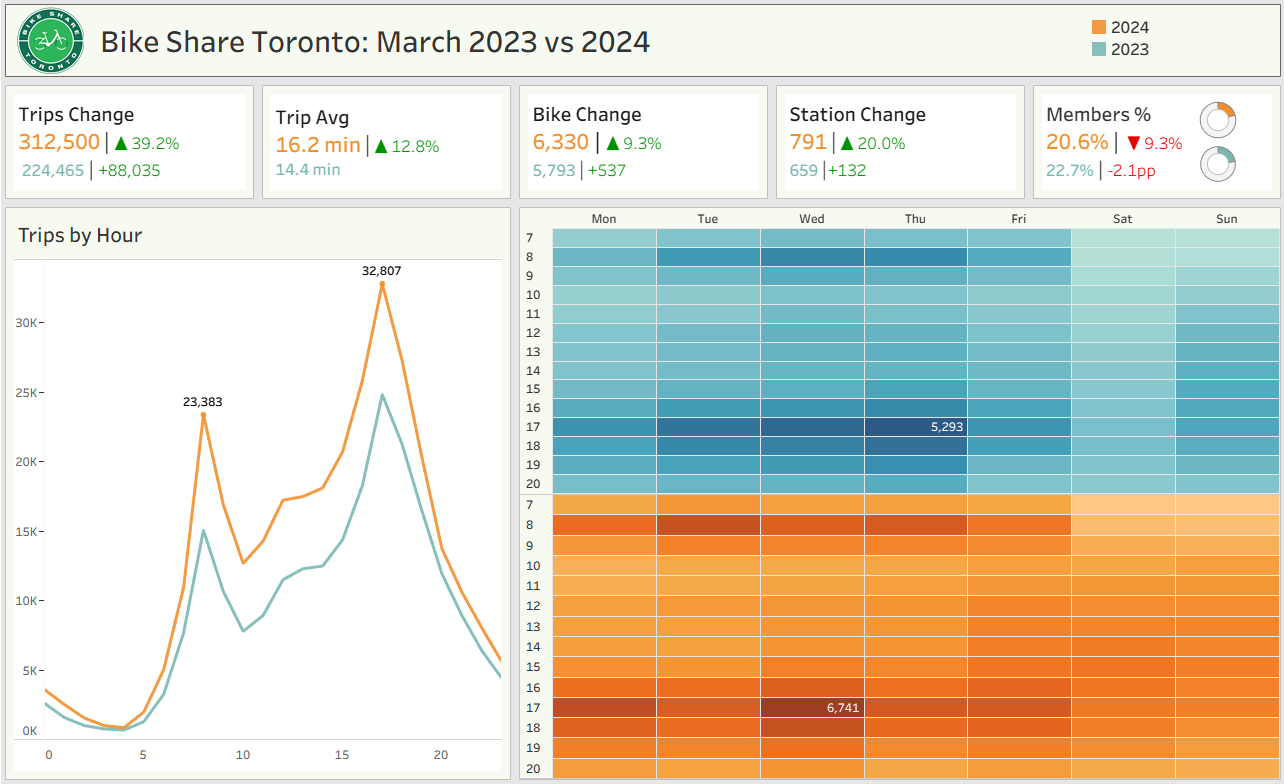
Key Observations
- Trip Volume: +39% (224k → 312k)
- Average Duration: +12.8% (14.4 → 16.2 min)
- Assets: +9% bikes and +20% stations
- Member Share: −2.1 pp (22.7% → 20.6%), casuals grew faster
- Saturday Spread: wider range of use, likely leisure and tourism
Interpretation
- Supply scaled with demand, not an overcapacity story
- Longer trips likely reflect leisure or extended routes
- Commute peaks remain; lighter Mondays and Fridays show hybrid effects
- More casuals in the funnel opens up retention and conversion plays
3) Commuter Patterns Dashboard
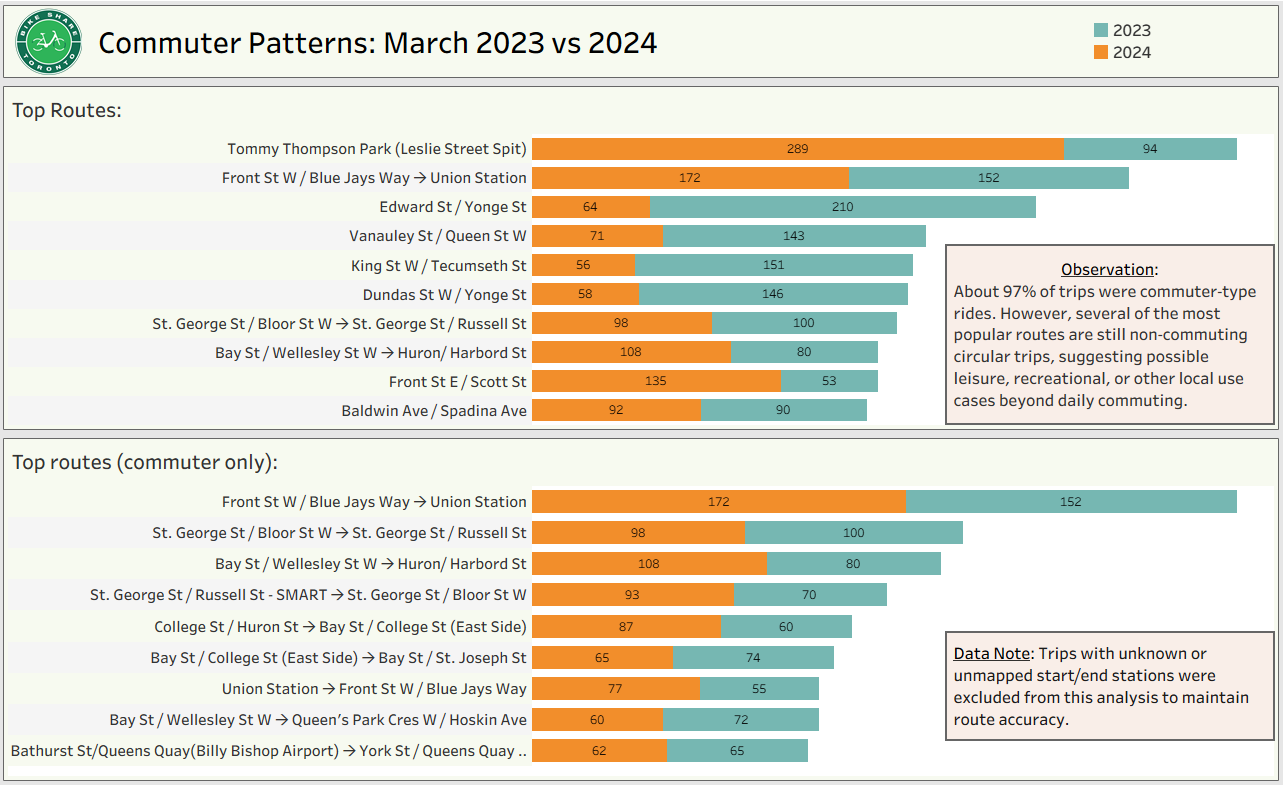
Routes with a single location such as Tommy Thompson Park are round trips. Trips with Unmapped stations were excluded from route mapping.
At a Glance
- ~97% of trips are point-to-point commuting
- Top corridors: Union Station, Front St, Bay St, Yonge St
- Loop routes: recreational trips like Tommy Thompson Park remain active
- 2024 growth: most high-traffic routes increased further, showing consolidation rather than fragmentation
Interpretation
- Bike Share Toronto serves primarily urban commuters with consistent weekday use
- Loop trips reflect weekend leisure demand
- Operational priority: dock turnover and rebalancing in core corridors during peaks
- Marketing insight: weekend casuals are candidates for day-pass → subscription funnels
Bottom line: the commuter network is expanding efficiently, sustaining weekday reliability while attracting weekend explorers.
Financial Extension — Business and Revenue Analysis
Why a financial view?
Bike Share Toronto’s open data does not include pricing, membership fees, taxes, or cost information.
To connect ridership trends to business outcomes, I added a trip-level revenue model using only publicly available pricing rules from the City of Toronto (2023 and 2024).
This keeps the analysis fully transparent:
- Revenue is modeled purely at the trip level (duration × bike model × user type)
- Membership fees, taxes, discounts, and account-level billing are not included
- Costs and profit are not yet modeled, because system-wide operational cost data is not available in the open dataset
- Any cost/profit KPIs visible in the dashboard are temporary placeholders, included only to show what a complete financial dashboard layout could look like
I have found official cost-per-trip figures provided by Bike Share Toronto, which will allow a more accurate cost model.
These will be integrated in a future update.
The financial portion of this project will remain trip-level only, meaning it will not include external costs such as:
- bike purchase and depreciation
- maintenance and repairs
- staff labour
- rebalancing/relocation costs
- charging infrastructure
- administration and overhead
Those are outside the scope of the ridership dataset, but the trip-level approach provides a realistic and defensible baseline.
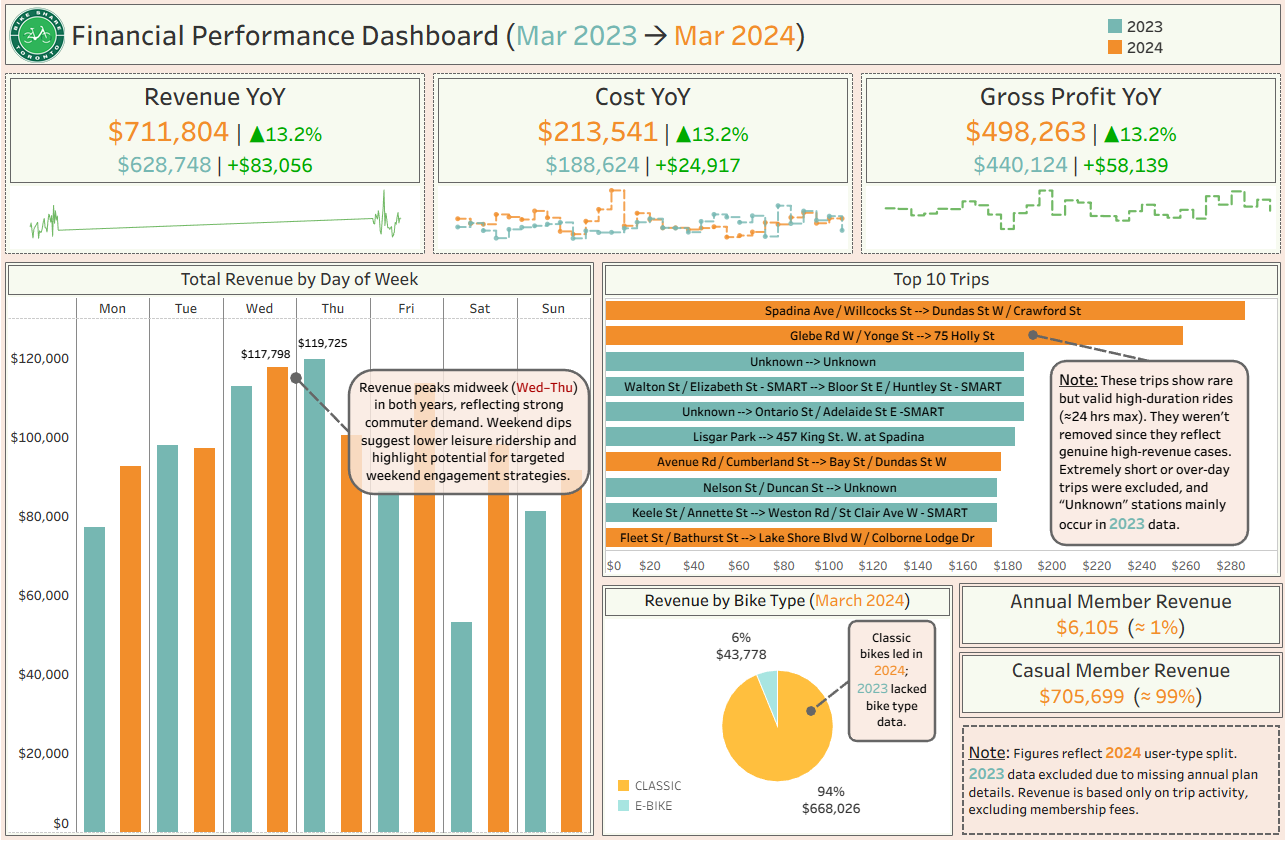
Revenue Findings (Trip-Level Only)
- March 2023 Revenue: $628,748
- March 2024 Revenue: $711,804
- YoY Growth: +13.2%
Additional observations:
- Midweek (Wed/Thu) shows the strongest revenue, matching commuter behaviour
- Classic bikes contribute ~94 percent of total revenue due to their volume
- Casual riders generate the highest per-trip revenue and represent a strong conversion opportunity
Interpretation
- Ridership and revenue increased year-over-year across both commuter and leisure segments
- Longer trip durations in 2024 suggest stronger leisure/tourism momentum
- Casual riders remain the key source of per-trip dollars
- Midweek revenue stability demonstrates reliable commuter demand
Note: Revenue is modeled accurately using official rate rules.
Cost and profit values shown in the dashboard are placeholders and will be replaced by a trip-level cost model using verified figures from Bike Share Toronto.
How the Trip-Level Revenue Model Works
New Excel Fields
| New Field | Purpose | Description |
|---|---|---|
| Est. Trip Revenue ($) | Revenue per trip | Applies rate rules by year, duration, bike model, and user type |
| Pricing Basis | Transparency | Labels such as “2024 casual classic per-min rate” |
Pricing Framework (Validated)
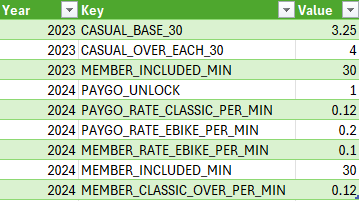
2023 Pricing
| User Type | Bike | Rule | Formula |
|---|---|---|---|
| Casual | Classic | Base 30 min | $3.25 flat + $4 per extra 30-min block |
| Annual | Classic | Included | $0 per trip (overage not identifiable) |
2024 Pricing
| User Type | Bike | Rule | Formula |
|---|---|---|---|
| Casual | Classic | Unlock + per-min | $1 + $0.12 × minutes |
| Casual | E-bike | Unlock + per-min | $1 + $0.20 × minutes |
| Annual | Classic | Overage only | MAX(0, minutes − 30) × $0.12 |
| Annual | E-bike | Per-min | $0.10 × minutes |
Additional Data Issue
| Issue | Year | Count | Likely Cause | Action |
|---|---|---|---|---|
| Annual member trips > 30 minutes | 2023 | 806 | Billing data not available | Excluded from revenue (cannot be priced reliably) |
References, Sources, and Assumptions
| # | Source | What it provides | How it was used |
|---|---|---|---|
| 1 | City of Toronto Background File (2023) | 2023 pricing structure | Used for 2023 casual/annual trip-level pricing rules |
| 2 | City of Toronto Background File (2024) | 2024 updated pricing | Used for 2024 unlock fees and per-minute rate rules |
| 3 | Bike Share Toronto Pricing | Public reference pricing | Validated trip pricing logic for modeling |
| 4 | Upcoming: Bike Share Toronto trip-level cost metrics | Verified system cost-per-trip values | Will replace placeholder cost/profit KPIs in the next update |
All financial figures reflect trip-level modeling only, based on publicly available pricing.
Membership fees, overhead costs, rebalancing, repairs, depreciation, and other operational expenses are outside the scope of the dataset.
A refined version with verified cost-per-trip values will be added once integrated.
Project Note
This financial extension is part of a personal data analytics project.
It is designed to demonstrate how trip-level modeling can be applied to an open mobility dataset.
The financial section is intentionally limited to fields available in the data.
A refined version with verified cost-per-trip values will be published soon.