Customer & Product Profitability Analytics Dashboard
Overview
This project analyzes an 18,432-transaction retail dataset using SQL and Power BI to answer critical business questions about profitability, customer behavior, and market performance.
The project shows a clear workflow from SQL transformation to Power BI dashboards, with all cleaning and metric engineering completed in SQL before visualization.
Business Questions This Analysis Answers
The SQL analysis and Power BI dashboards address these key business questions:
Product & Profitability: - Which product categories generate the highest revenue? - Which categories actually drive profit (not just sales)? - Which sub-categories are the true margin leaders?
Market Performance: - Which countries and markets outperform others? - How do sales and profit evolve over time?
Customer Behavior: - Who are the highest-value customers? - Which age groups drive the most revenue? - Does gender influence spending patterns? - Which regions consistently attract high-value sales?
Project Purpose
Motivation
Understanding which products and markets actually drive profitability is crucial for business decision-making. Revenue alone doesn’t tell the full story. This project explores the gap between high-revenue categories and high-profit categories, revealing patterns that can inform pricing, inventory, and marketing strategies.
Core Question
Which products, markets, and customer segments drive profitability, and how do revenue and profit patterns differ across categories and regions?
Why This Dataset?
This retail transaction dataset provides a realistic view of profitability challenges in a competitive market. The data includes product categories, customer demographics, geography, pricing, and costs, making it ideal for understanding margin dynamics and identifying opportunities for optimization.
Tools & Technologies
- SQL: MySQL Workbench - data transformation and analysis
- Power BI: Dashboard development and visualization
Data Summary
- Source: Analyzing Customer Spending Habits (Kaggle)
- Original Author: Vineet Bahl
- Dataset: SalesForCourse_quizz_table.csv
- Volume: 18,432 transactions
- Time Period: January 2015 - July 2016
- Key Fields: Date, Year, Month, Customer Age, Customer Gender, Country, State, Product Category, Sub Category, Quantity, Unit Cost, Unit Price, Revenue
- Data Structure: Single flat table format (not normalized). In a production environment, this data would typically be stored across multiple normalized tables (e.g.,
orders,order_items,customers,products,inventory). - Key Limitation: The dataset lacks product-level IDs and customer IDs, which limits product-specific tracking and individual customer analysis. See the Data Limitations section for details.
Data Preparation (SQL)
Before visualization, the raw dataset required significant transformation. All cleaning and metric engineering was completed in MySQL using structured SQL scripts.
Transformation Steps
- Standardized column names - converted spaces to underscores for SQL compatibility
- Date conversion - transformed text-based dates (
MM/DD/YY) into properDATEtype - Metric engineering - calculated
ProfitandProfit_Marginat the transaction level - Data validation - ran checks for nulls, negative values, and revenue calculation mismatches
SQL Transformation Script
The complete transformation script is available for download: transformations.sql
Key transformations:
-- Standardize column names
ALTER TABLE sales_transactions
CHANGE COLUMN `Customer Age` Customer_Age INT,
CHANGE COLUMN `Customer Gender` Customer_Gender VARCHAR(10),
CHANGE COLUMN `Product Category` Product_Category VARCHAR(50),
CHANGE COLUMN `Sub Category` Sub_Category VARCHAR(50);

-- Convert text dates to DATE type
UPDATE sales_transactions
SET Date_Formatted = STR_TO_DATE(Date, '%m/%d/%y');

-- Add derived business metrics
UPDATE sales_transactions
SET Profit = (Unit_Price - Unit_Cost) * Quantity,
    Profit_Margin = ROUND(Profit / Revenue * 100, 2);
What this does:
- Column name standardization (e.g.,
Customer AgetoCustomer_Age) - Date parsing using
STR_TO_DATE()with format'%m/%d/%y' - Profit calculation:
(Unit_Price - Unit_Cost) * Quantity - Profit margin:
(Profit / Revenue) * 100
Exploratory Analysis (SQL)
After transformation, exploratory queries were run to understand profitability patterns, validate data quality, and prepare insights for visualization.
Analysis Queries
The complete analysis script is available for download: analysis_queries.sql
Example queries:
-- Executive Summary Metrics
SELECT
    ROUND(SUM(Revenue), 2) AS Total_Revenue,
    ROUND(SUM(Profit), 2) AS Total_Profit,
    ROUND(AVG(Profit_Margin), 2) AS Avg_Profit_Margin,
    SUM(Quantity) AS Total_Units_Sold,
    COUNT(*) AS Total_Transactions
FROM sales_transactions;

-- Revenue / Profit by Product Category
SELECT
    Product_Category,
    ROUND(SUM(Revenue), 2) AS Total_Revenue,
    ROUND(SUM(Profit), 2) AS Total_Profit,
    ROUND(AVG(Profit_Margin), 2) AS Avg_Profit_Margin
FROM sales_transactions
GROUP BY Product_Category
ORDER BY Total_Profit DESC;
Analysis covered:
- Executive summary metrics (total revenue, profit, margin)
- Product category and sub-category profitability
- Regional performance (country and state level)
- Monthly revenue and profit trends
- Customer segmentation by age and gender
- Margin analysis across product lines
Key Findings
Executive Summary
| Metric | Value |
|---|---|
| Total Revenue | $12.94M |
| Total Profit | $1.30M |
| Average Profit Margin | 13.37% |
| Total Units Sold | 36,805 |
| Total Transactions | 18,432 |
Profitability by Product Category
The analysis reveals a clear pattern: accessories drive profit, while bikes drive volume.
| Category | Revenue | Profit | Avg Margin | Units Sold |
|---|---|---|---|---|
| Accessories | $3.97M | $740,630 | 17.23% | 22,873 |
| Clothing | $1.91M | $304,852 | 14.80% | 5,692 |
| Bikes | $7.06M | $257,559 | 1.49% | 8,240 |
What this tells us:
- Accessories and Clothing drive the majority of profit due to strong margins (17% and 15% respectively)
- Bikes generate the highest revenue ($7M+) but deliver extremely low margin (~1.5%)
- This is a classic retail pattern: high-ticket items equal low margin; accessories equal high margin
The bike category is essentially a volume play. It brings in revenue but doesn’t contribute much to the bottom line. Meanwhile, accessories are the real profit engine.
Most Profitable Sub-Categories
High-margin accessories dominate profit generation, while high-revenue bike categories struggle with thin margins.
| Sub-Category | Revenue | Profit | Avg Margin |
|---|---|---|---|
| Helmets | $1.44M | $272,058 | 17.27% |
| Tires and Tubes | $1.36M | $244,189 | 16.80% |
| Jerseys | $1.01M | $165,593 | 14.45% |
| Mountain Bikes | $4.02M | $129,768 | 1.44% |
| Bottles & Cages | $377,929 | $70,565 | 17.24% |
| Touring Bikes | $935,282 | $65,686 | 4.49% |
| Fenders | $300,787 | $63,832 | 20.35% |
| Road Bikes | $2.11M | $62,106 | 0.61% |
| Shorts | $390,164 | $52,134 | 12.23% |
| Hydration Packs | $265,017 | $45,237 | 15.60% |
| Vests | $220,398 | $34,839 | 14.08% |
| Gloves | $110,139 | $23,674 | 20.18% |
| Caps | $140,652 | $23,499 | 15.25% |
| Bike Racks | $98,139 | $21,893 | 22.68% |
| Bike Stands | $83,539 | $14,374 | 17.08% |
Key observations:
- Helmets, Tires & Tubes, and Jerseys dominate profit generation with strong margins (14-17%)
- High-margin accessories like Fenders (20.35%), Gloves (20.18%), and Bike Racks (22.68%) are the true profit drivers
- Mountain Bikes generate $4M+ revenue but only $130k profit (1.44% margin)
- Road Bikes show the lowest margin at 0.61% despite $2.1M revenue, indicating heavy price pressure or cost issues
This is where the story gets interesting. Small-ticket items like fenders and gloves are generating margins above 20%, while the high-revenue bike categories are barely breaking even. If I were making pricing decisions, I would focus on protecting margins in accessories and figuring out why bikes are so thin.
Regional Performance
Germany stands out as the most profitable market, while the United States leads in volume but lags in efficiency.
| Country | Revenue | Profit | Avg Margin | Transactions |
|---|---|---|---|---|
| Germany | $2.63M | $577,345 | 26.37% | 2,837 |
| United States | $5.27M | $375,840 | 11.36% | 8,871 |
| United Kingdom | $2.84M | $210,084 | 12.10% | 3,826 |
| France | $2.20M | $139,772 | 8.49% | 2,898 |
Insights:
- Germany is the most profitable market with the strongest margins (26.37%) despite fewer transactions. This suggests a premium product mix or less aggressive discounting.
- United States leads in revenue and volume but has significantly lower margins (11.36%), suggesting heavier discounting or a product mix skewed toward low-margin categories.
- France shows the weakest margin performance (8.49%) among top markets.
Germany’s performance is particularly striking. They are generating more profit with fewer transactions, which points to either higher prices, a better product mix, or stronger brand positioning. The US market, while high-volume, is clearly operating on thinner margins.
Monthly Revenue & Profit Trends
A dramatic shift occurred between 2015 and 2016, with revenue and profit exploding in late 2015 and 2016 showing massive year-over-year growth.
Key patterns:
- Huge seasonal spike: Revenue and profit explode from July → December 2015, with December 2015 reaching $1.19M revenue
- 2016 Q1-Q2 is dramatically stronger than 2015 with clear year-over-year growth (January 2016: $1.02M vs January 2015: $157k)
- Early 2015 shows consistently negative profit margins, flipping positive mid-year
- 2016 performance suggests either business expansion, pricing strategy changes, or product mix shifts
| Year | Month | Revenue | Profit |
|---|---|---|---|
| 2015 | January | $157,860 | -$2,742 |
| 2015 | June | $243,409 | -$3,531 |
| 2015 | July | $484,449 | $8,978 |
| 2015 | August | $705,931 | $40,267 |
| 2015 | December | $1,196,429 | $37,447 |
| 2016 | January | $1,016,294 | $162,339 |
| 2016 | March | $1,107,363 | $177,451 |
| 2016 | June | $1,359,297 | $215,844 |
Understanding the 2015-2016 Surge:
The data clearly shows what drove the massive increase: 2016 had significantly more transactions and units sold compared to 2015. When filtering the dashboard by year, 2016 shows roughly 70% more transactions and units sold than 2015. This volume growth directly explains the revenue and profit surge.
The question of why volume increased so dramatically could be answered by several factors: business expansion into new markets or channels, successful marketing campaigns, new product launches, or competitive positioning. However, without product-level IDs or marketing data in this dataset, I cannot pinpoint exactly which specific products, campaigns, or strategies drove the volume growth. The analysis focuses on aggregate patterns at the category level. For more details on data limitations, see the Data Limitations & Assumptions section.
Customer Segmentation Insights
Revenue by Age:
- Ages 28-31 drive the highest revenue (core buyer segment)
- Revenue remains strong across late 30s-early 40s, suggesting mature customers also spend heavily
- Very young (18-23) and very old (60+) ages contribute minimal revenue
Top revenue-generating ages: 28 ($563k), 31 ($523k), 29 ($513k), 40 ($480k), 30 ($477k)
The 28-31 age group is clearly the sweet spot. These are likely customers in their early career growth phase with disposable income and active lifestyles. The fact that 40-year-olds also rank high suggests this isn’t just a young person’s market. There’s value in the mid-career segment too.
Dashboards & Insights
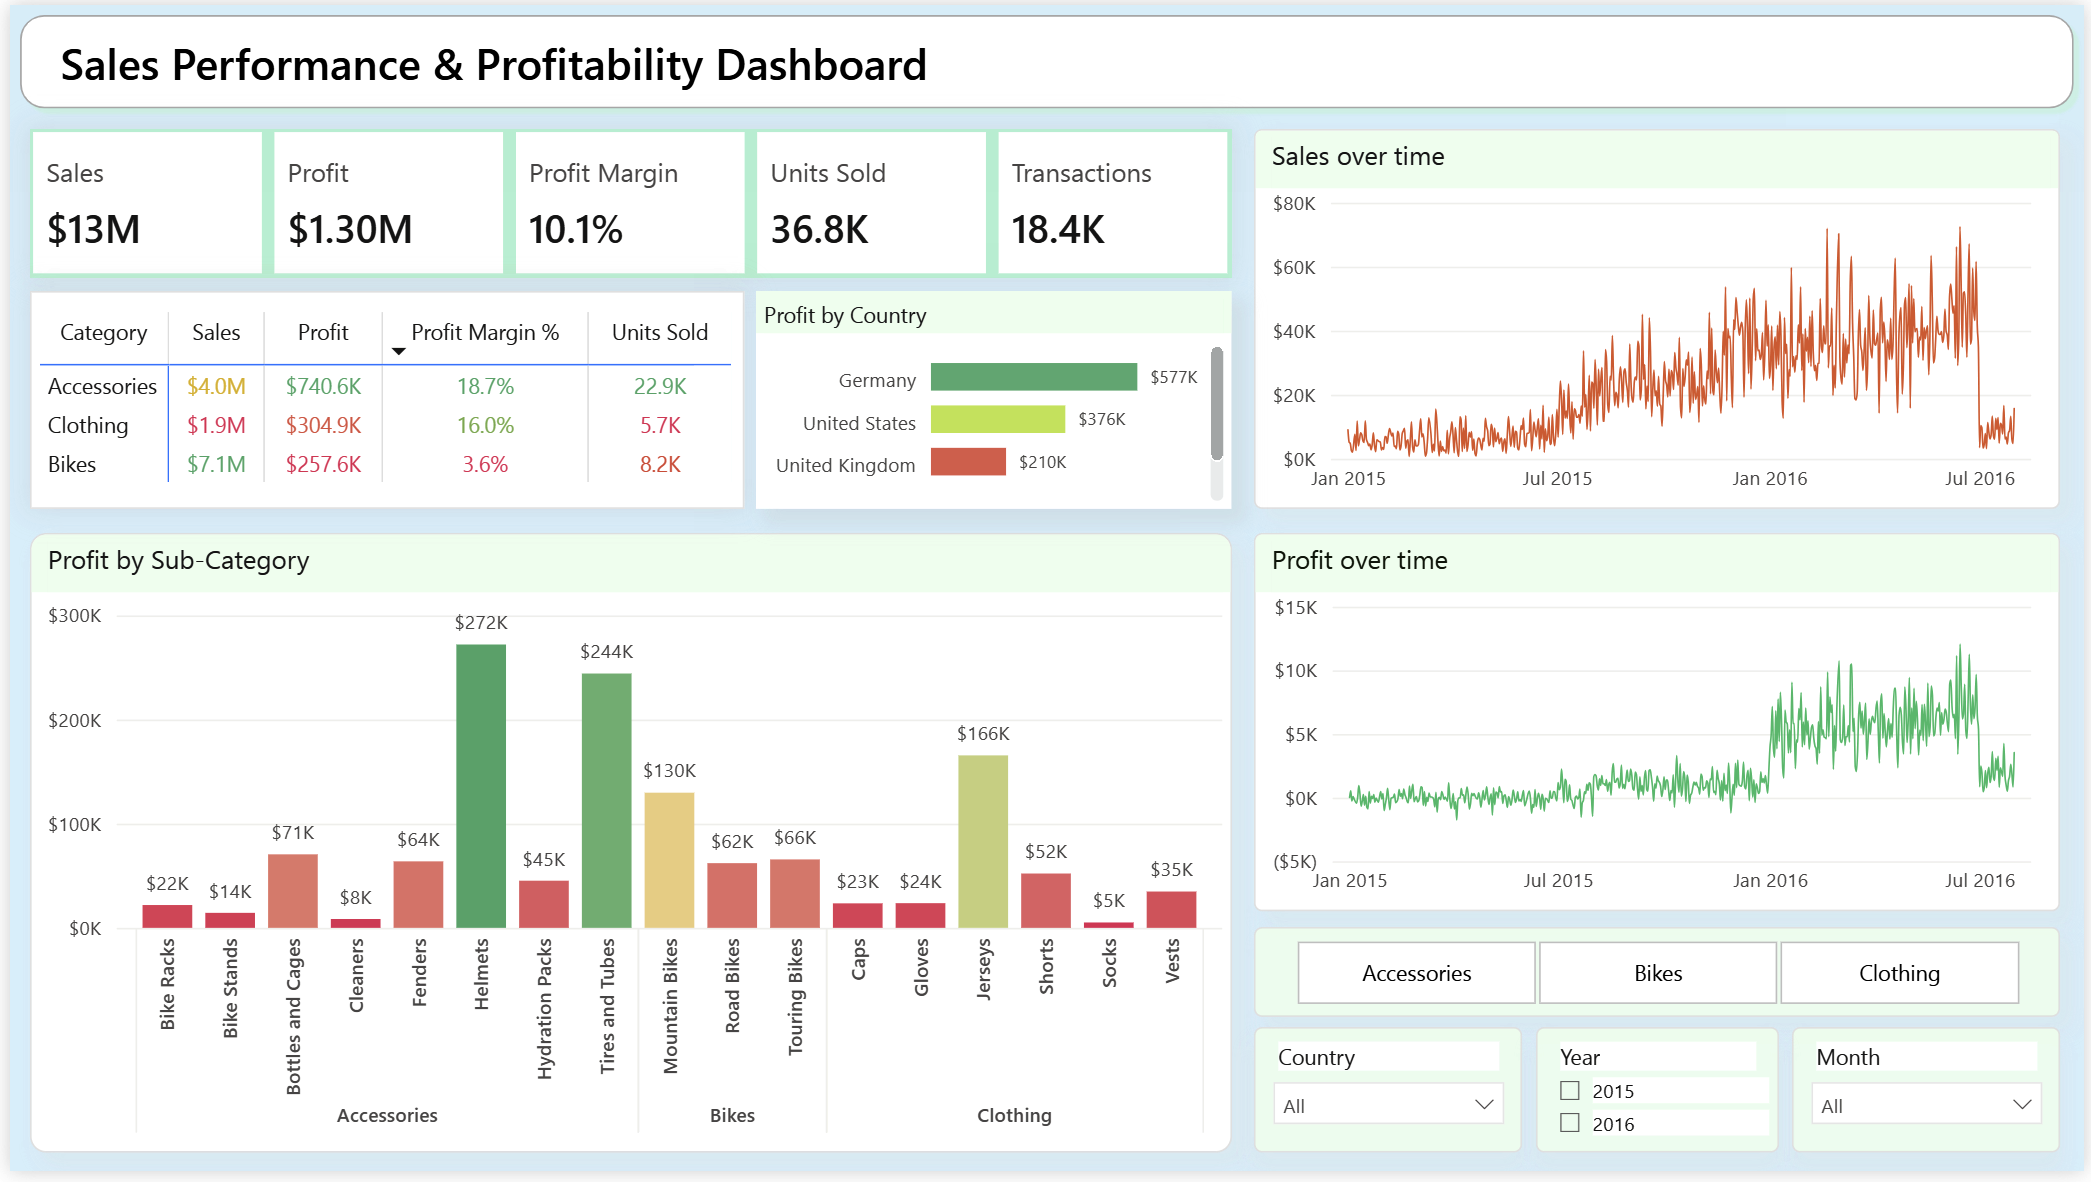
Dashboard 1: Sales Performance & Profitability
This dashboard focuses on understanding what drives revenue and profit at a product and market level. It answers the business questions listed at the top of this page.
The interactive Power BI dashboard requires a paid subscription to share publicly. A GIF demonstrating the interactive filtering capabilities will be added soon.
Key Insights:
- Accessories & Clothing produce the strongest margins (17-15%), while Bikes generate $7M+ revenue but only 1.5% margin - a classic low-margin, high-volume pattern
- Helmets, Tires & Tubes, Jerseys, Fenders, and Gloves dominate profit among sub-categories
- Germany is the best-performing region by profit margin (26%), while the US leads volume but not efficiency
- A strong seasonal spike occurs from Q3-Q4 2015 to Q1-Q2 2016. See the Monthly Revenue & Profit Trends section for details on interpreting this surge.
Dashboard Components:
- KPI cards: Total Sales, Profit, Margin, Units Sold, Transactions
- Category-level analysis: Revenue and profit breakdown by product category
- Regional performance: Profit by country with margin indicators
- Time series: Sales and profit trends over time
- Sub-category drill-down: Top profit-generating products
- Interactive slicers: Filter by Category, Country, Year, Month
Dashboard 2: Customer Insights & Behavioral Analysis
Coming Soon
This dashboard will focus on understanding who the customers are, how they behave financially, and which segments contribute the most value. These insights support decisions related to pricing, targeted promotions, regional strategy, and customer segmentation.
Business Questions to be Answered:
- Who are the highest-value customers?
- Which age groups drive the most revenue?
- Does gender influence spending patterns?
- How does Average Order Value (AOV) differ across demographic or geographic groups?
- Which regions consistently attract high-value sales?
Planned Insights (from SQL Analysis):
Customer Demographics: - Ages 28-31 are the core revenue-generating segment - Revenue remains strong across late 30s-early 40s - Gender-based differences in purchasing behavior
Regional Customer Value: - Germany produces the highest-value customers with premium product mix - United States leads volume but shows lower per-customer value - France underperforms across customer value metrics
Product Preferences by Segment: - High-margin accessories (Helmets, Tires, Jerseys) are customer favorites - Accessory-driven purchases drive profitability, not high-ticket bikes
Data Limitations & Assumptions
This analysis is based on a single-table transaction dataset with aggregate-level information. Understanding these limitations is important for interpreting the insights accurately.
Data Structure Limitations
No Product-Level Identifiers: - The dataset includes product categories and sub-categories but not individual product SKUs or IDs - Cannot track specific product pricing changes over time - Cannot identify which exact products drove revenue spikes or margin changes - Product-level profitability analysis is limited to category/sub-category aggregates
No Customer Identifiers: - No unique customer IDs are present in the dataset - Cannot perform customer lifetime value (CLV) analysis - Cannot track repeat purchase patterns or customer journey analysis - Customer segmentation is limited to demographic aggregates (age, gender, location)
Single-Table Format: - Data is stored in a single flat table rather than normalized relational structure - In production environments, this would typically be split across multiple tables (orders, order_items, customers, products, inventory) - Limits ability to perform complex join-based analysis - Requires assumptions about data relationships
Assumptions in Analysis
Profitability & Revenue Trends: - When interpreting spikes in revenue or profit (like the 2015-2016 surge), multiple plausible explanations are considered: business expansion, pricing strategy changes, product mix shifts, or volume growth - Without product-level detail, changes cannot be definitively attributed to specific factors - Analysis focuses on aggregate patterns that are observable at the category and transaction level
Regional Performance: - Country and state-level insights assume consistent data quality and categorization across regions - Differences in margin could reflect pricing strategies, product mix variations, or data collection differences - Regional comparisons are valid at the aggregate level but may mask local variations
Customer Segmentation: - Age and gender-based insights are aggregate-level only - Individual customer behavior patterns cannot be analyzed without customer IDs - Demographic insights represent group-level patterns, not individual customer journeys
Impact on Insights
These limitations are common in exploratory analytics projects using public datasets. The insights presented in this project focus on aggregate patterns (category profitability, regional performance, seasonal trends) that are robust despite these constraints. The analysis is designed to answer business questions at the category, regional, and demographic segment levels rather than individual product or customer levels.
For production analytics, additional data sources (product IDs, customer IDs, normalized schema) would enable deeper analysis including: - Product-level pricing optimization - Customer lifetime value and retention analysis - Individual customer segmentation and targeting - More granular profitability analysis
Key Takeaways
This project demonstrates a complete, end-to-end analytics workflow from raw data to business insights:
- Profitability is driven by accessories, not high-ticket bikes
- Bike categories require margin intervention due to extremely low profitability despite large revenue
- Germany is the strongest-performing region, with high margins and strong customer value
- Ages 28-31 represent the most valuable demographic segment
- Customer behavior varies sharply by age, gender, and region, offering multiple opportunities for targeted promotions and pricing refinement
Together, the dashboards support product, pricing, and customer decisions by presenting clear KPIs, performance visuals, and segmentation insights.
Project Note
This is a personal data analytics project completed as part of my portfolio development. The analysis demonstrates end-to-end analytics capabilities from SQL data transformation to Power BI visualization, using a publicly available retail transaction dataset.
Dataset Attribution: - Dataset: Analyzing Customer Spending Habits - Source: Kaggle - Original Author: Vineet Bahl - License: Dataset copyright by authors (Creative Commons Attribution-ShareAlike)
All analysis, insights, visualizations, and interpretations presented in this project are my own work. The SQL transformation scripts, Power BI dashboards, and business insights were developed independently for educational and portfolio purposes.